 Intro to Pandas 3
Week 2 | Lesson 3.1
LEARNING OBJECTIVES
After this lesson, you will be able to:
- Demonstrate how to use pandas.pivot_table
- Demonstrate how to use the parameters: values, columns, index, aggfunc, and margins
INSTRUCTOR PREP
Before this lesson, instructors will need to:
- Read in / Review any dataset(s) & starter/solution code
- Generate a brief slide deck
STARTER CODE
LESSON GUIDE
| TIMING | TYPE | TOPIC |
|---|---|---|
| 10 min | Introduction | pandas.pivot_table |
| 10 min | Demo / Guided Practice | values |
| 10 min | Demo / Guided Practice | columns |
| 10 min | Demo / Guided Practice | index |
| 10 min | Demo / Guided Practice | aggfunc |
| 10 min | Demo / Guided Practice | margins |
| 25 min | Independent Practice | |
| 5 min | Conclusion |
Introduction: Topic (10 mins)
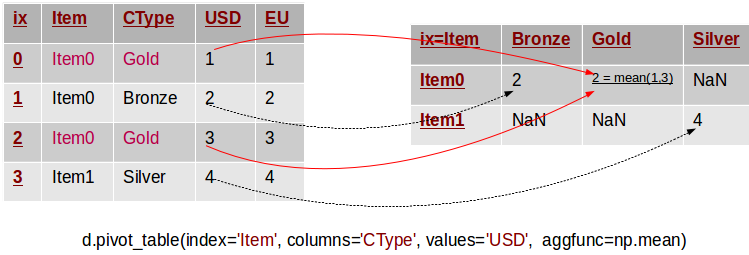
A pivot table can automatically sort, count, total or give the average of the data stored in one table or spreadsheet, displaying the results in a second table showing the summarized data. Pivot tables are also useful for quickly creating unweighted cross tabulations. The user sets up and changes the summary's structure by dragging and dropping fields graphically. This "rotation" or pivoting of the summary table gives the concept its name.
The function pandas.pivot_table can be used to create spreadsheet-style pivot tables. It takes a number of arguments:
- data: A DataFrame object
- values: a column or a list of columns to aggregate
- index: a column, Grouper, array which has the same length as data, or list of them. Keys to group by on the pivot table index. If an array is passed, it is being used as the same manner as column values.
- columns: a column, Grouper, array which has the same length as data, or list of them. Keys to group by on the pivot table column. If an array is passed, it is being used as the same manner as column values.
- aggfunc: function to use for aggregation, defaulting to numpy.mean
- margins: boolean, default False, Add row/column margins (subtotals)
Let's take a look at each of the arguments.
Demo / Guided Practice: index (10 mins)
Here is a link to the demo code.
import pandas as pd
import numpy as np
Read in sales.csv as a pivot table.
df = pd.read_csv('sales.csv')
The simplest pivot table must have a dataframe and an index . Let’s use the Name as our index.
pd.pivot_table(df,index=["Name"])
How about indexing on multiple values. Let's look at the data by Manager and Rep next.
pd.pivot_table(df,index=["Manager","Rep"])
The pivot table is smart enough to start aggregating the data and summarizing it by grouping the reps with their managers.
Check What might be another way that we would want to pivot the data and why?
Demo / Guided Practice: values (10 mins)
What we really want to take a look at next is Price. So, the Account and Quantity columns aren’t useful. Let’s remove them and explicitly define the 'Price' column by using the values field.
pd.pivot_table(df,index=["Manager","Rep"],values=["Price"])
Check Why did we remove the Account and Quantity columns?
Demo / Guided Practice: aggfunc (10 mins)
The 'Price' column automatically averages the data. We can do a count or a sum by using aggfunc and np.sum.
pd.pivot_table(df,index=["Manager","Rep"],values=["Price"],aggfunc=np.sum)
Here is some more info on aggfunc.
Demo / Guided Practice: columns (10 mins)
Columns are optional. They are an additional way to segment the values you care about. But remember, the aggregation functions are applied to the values you list.
pd.pivot_table(df,index=["Manager","Rep"],values=["Price"],
               columns=["Product"],aggfunc=[np.sum])
Quantity might be useful, let's add it to the values list.
pd.pivot_table(df,index=["Manager","Rep"],values=["Price","Quantity"],
               columns=["Product"],aggfunc=[np.sum])
To get a different take on things, let's remove Product from the columns and add it to the index.
pd.pivot_table(df,index=["Manager","Rep","Product"],
               values=["Price","Quantity"],aggfunc=[np.sum])
Check: Are aggregation functions applied to columns?
Let's review what we know about columns.
Demo / Guided Practice: margins (10 mins)
The margins argument let's us see totals if we set it to margins=True.
pd.pivot_table(df,index=["Manager","Rep","Product"],
               values=["Price","Quantity"],
               aggfunc=[np.sum,np.mean],margins=True)
Here is some more information on margins.
Independent Practice: (25 minutes)
Use the raw data provided __ .
- Convert the raw data into a data frame
- Convert the df into a pivot table, index on 'regiment' and 'company'
Bonus
- What are the totals of postTestScore and preTestScore?
Hint: Use pivot tables.
Conclusion (5 mins)
Are aggregation functions applied to columns? If not, what is the aggregation function applied to?