 Welcome to GA's Data Science Immersive!
Week 1 | Day 1
LEARNING OBJECTIVES
After this lesson, you will be able to:
- Describe the roles and components of a successful learning environment
- Define data science and the data science workflow
- Apply the data science workflow to meet your classmates
STUDENT PRE-WORK
Before this lesson, you should already be able to:
- Define basic data types used in object-oriented programming
- Recall the Python syntax for lists, dictionaries, and functions
- Create files and navigate directories using the command line interface (for your specific environment)
INSTRUCTOR PREP
Before this lesson, instructors will need to:
- Modify GA DSI orientation deck
- Review course syllabus & projects
- Prepare for rest of Week 1, Day 1
LESSON GUIDE
| TIMING | TYPE | TOPIC |
|---|---|---|
| 20 min | Opening | Welcome to GA! |
| 20 min | Introduction | What is Data Science? |
| 10 min | Quiz | Data Science Pop-Quiz :) |
| 25 min | Introduction | Data Science Workflow |
| 25 min | Guided Practice | Workflow Application |
| Optional | Demo | Data Science Tools / Onboarding Review |
| 5 min | Conclusion | Review |
Welcome to GA! (20 mins)
Instructors: Feel free to use / modify our sample GA DSI orientation deck provided here.
GA is a Special Learning Environment
- GA is: a global community of individuals empowered to pursue the work we love.
- GA Resources: any relevant discounts, community events, hub, office hours
- GA feedback loop: exit tickets, mid-course feedback, final feedback
Road to Success
- Emotional cycle of change
- Student learning responsibility
- GA graduation requirements
- After GA: build network, find opportunities, community, perks
Your Instructional Team!
- Who we are
- Our professional backgrounds
- Our data interests
Introduction: What is Data Science? (20 mins)
- A set of tools and techniques used to extract useful information from data
- An interdisciplinary, problem-solving oriented practice
- The application of scientific techniques to practical problems
Who uses Data Science?
- Netflix movie recommendations
- Amazon's algorithm - "If you like X, you might also like Y"
- Five Thirty Eight (election and sports coverage)
- Draft Kings: using data science to predict daily bets
- Google: auto-translate and search results
Check: Can you think of some other well-known examples?
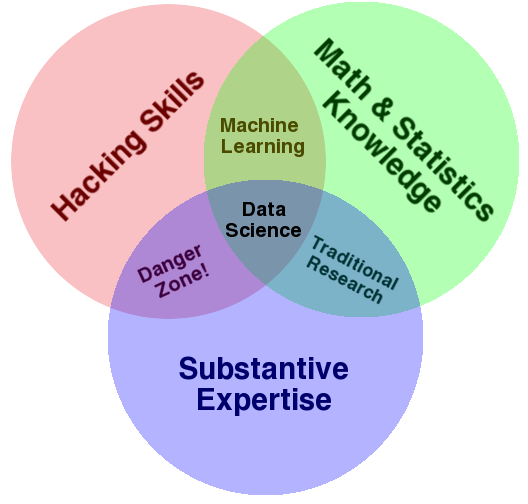
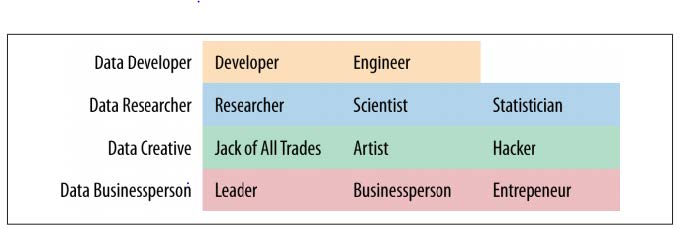
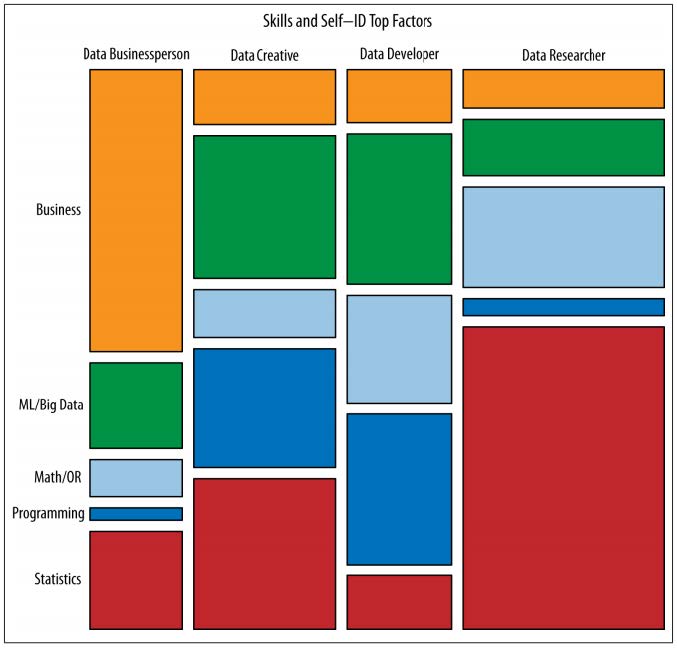
What are some typical roles in Data Science?
Common Roles:
- Business Intelligence
- Data Analyst
- Data Researcher
- Data Scientist
- Data Engineer
- Statistician
Common Skills:
- Business Intelligence
- Machine learning
- Big data
- Programming
- Stats
- Math (Calculus, algebra)
- Critical thinking
- storytelling
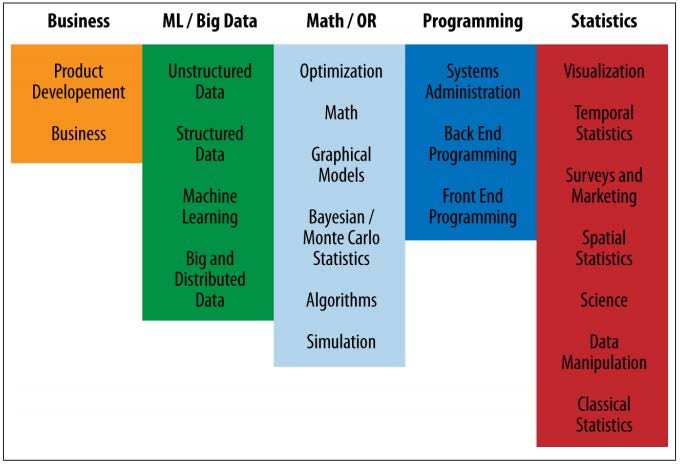
Breakdown of Skills by Role:
Quiz: Data Science Baseline (10 Min)
Instructor Note: This quiz is intended as a gauge of your students' background knowledge about common data science related topics. It is intended to estimate their prior knowledge and give you a chance to address misconceptions and tailor future materials accordingly. You are welcome to substitute or modify this quiz as you see fit.
Quiz
- True or False: Gender (coded: male= 0 female= 1) is a continuous variable
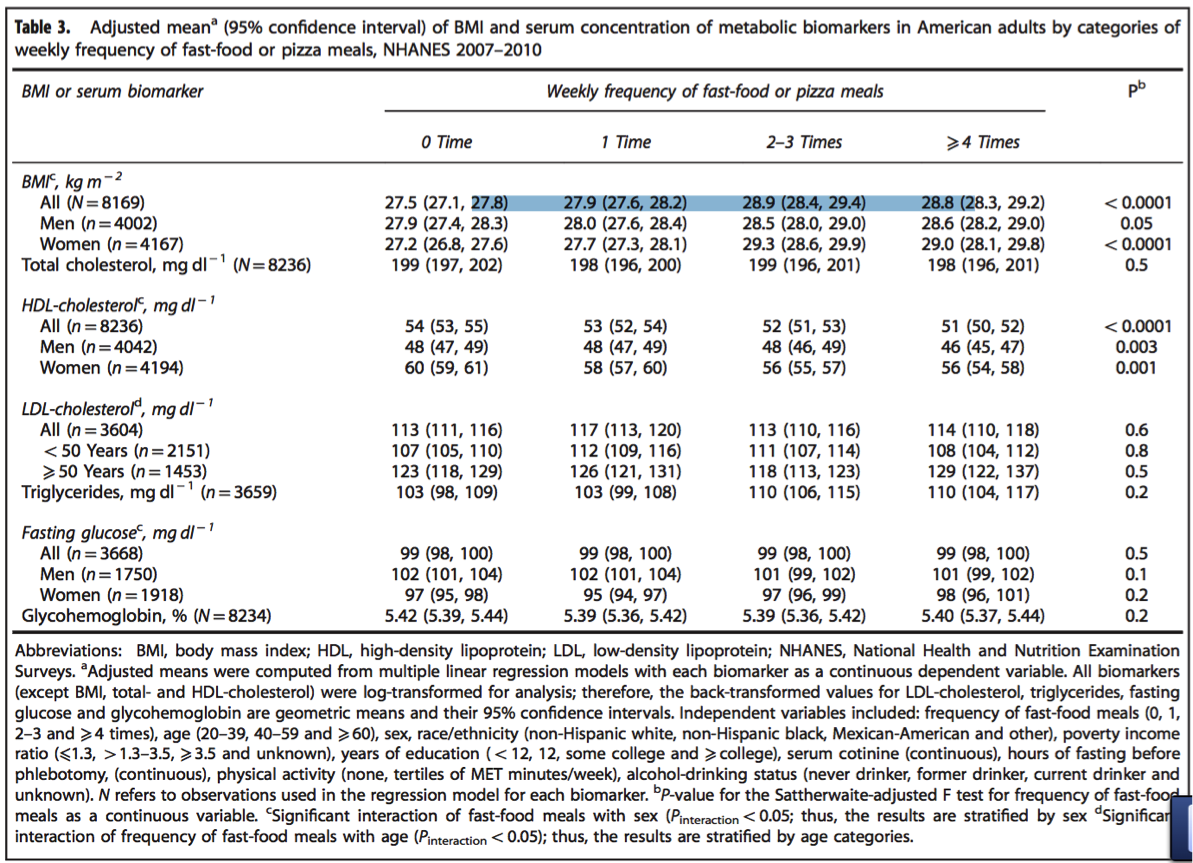
According to the table below, BMI is the _
- Outcome
- Predictor
- Covariate
- Draw a normal distribution.
- True or False: Linear regression is an unsupervised learning algorithm.
- What is a hypothesis test?
Instructor Note: Discuss results. What trends do you spot? What features can you extract from their answers?
Introduction: The Data Science Work Flow (25 mins)
Overview of Steps:
Throughout the class - and for our projects - we will be following the data science workflow. This workflow will help you produce reliable and reproducible results.
- Reliable = Accurate findings
- Reproducible = Others can follow your steps and get the same results!
Data Science Workflow Steps:
- Identify
- Acquire
- Parse
- Mine
- Refine
- Build
- Present
- Optional: Deploy!
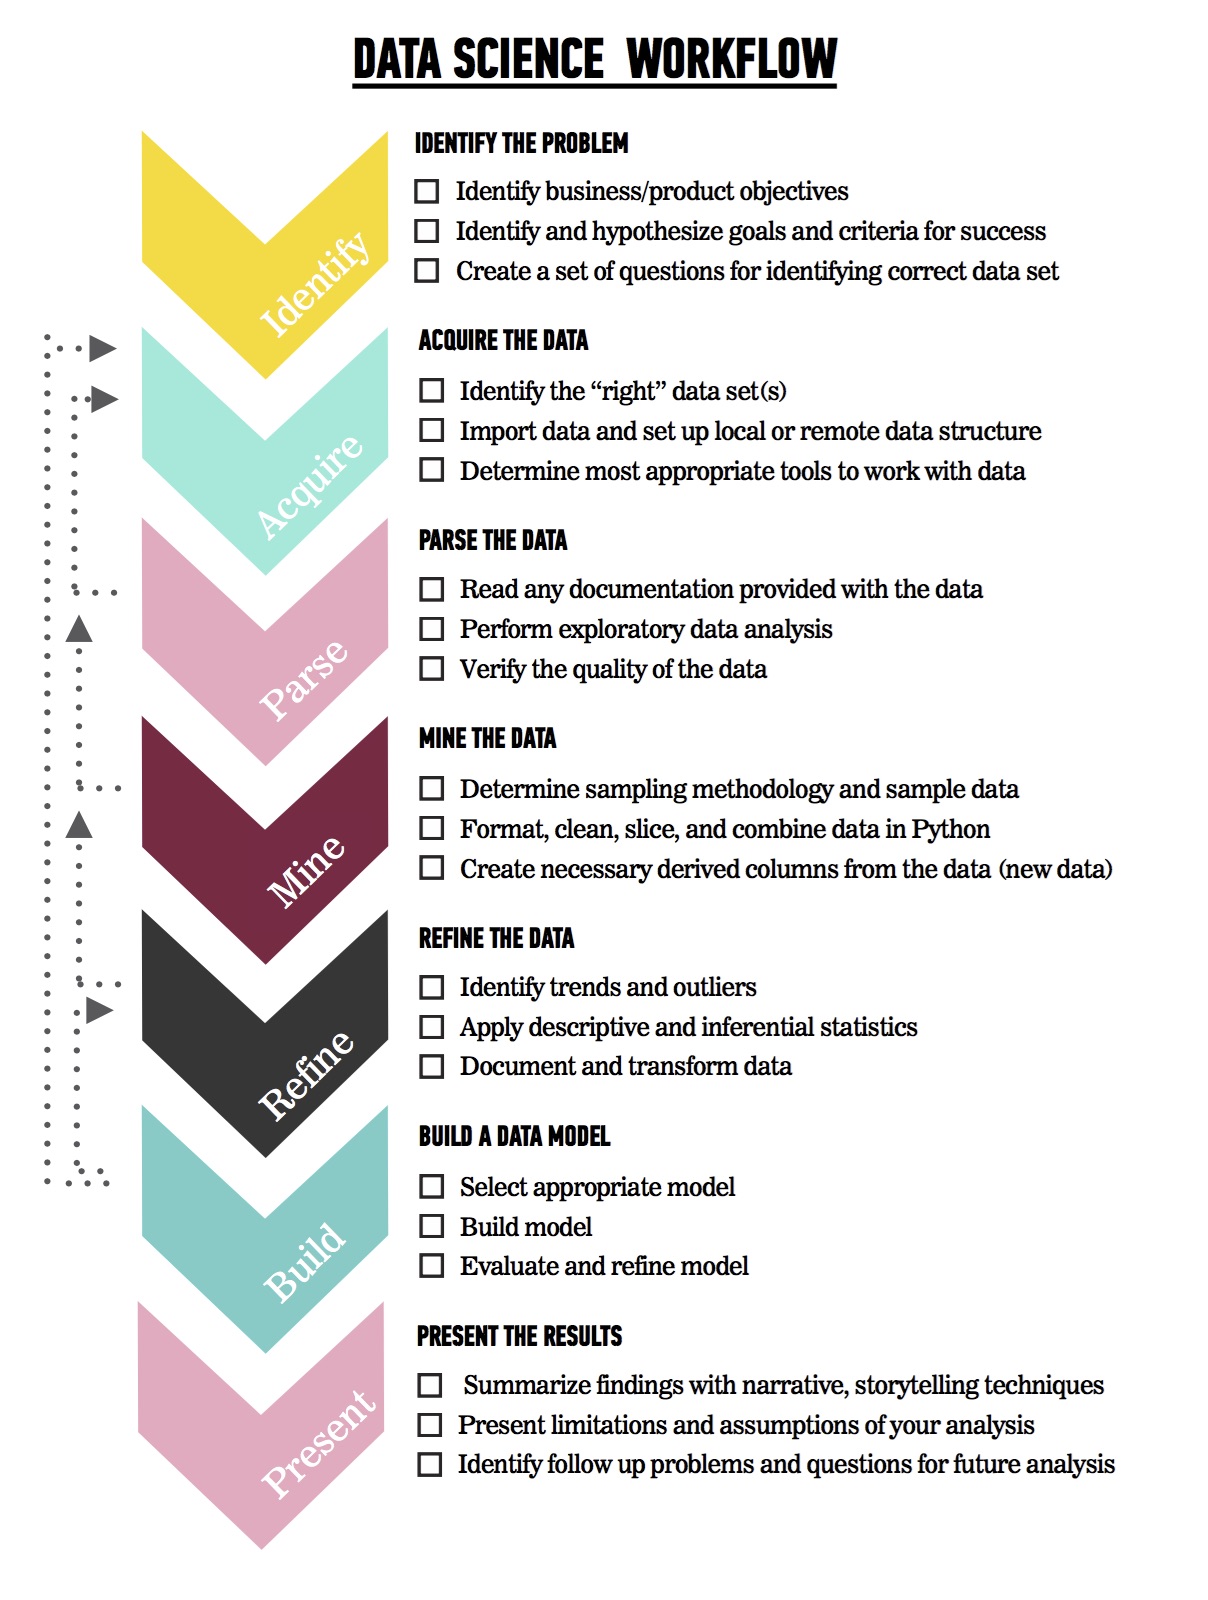
Note: While this may appear to be a linear process, this is in fact a bit simplified. Realistically, at any point, you may need to repeat earlier steps in order to iterate through the workflow, depending on whether you change your goals, acquire new data, or are trying to fine-tune your model.
Overall, the Data Science Workflow will serve as a useful set of standards and as a reference for our course projects.
Let's review these steps a bit further:
IDENTIFY: Understand the problem
- Identify business/product objectives.
- Identify and hypothesize goals and criteria for success.
- Create a set of questions to help you identify the correct data set.
ACQUIRE: Obtain the data
Ideal Data vs. Available Data Often times we start by identifying the ideal data we would want for a project.
During the data acquisition phase, we'll learn about what data is available and any limitations it may have. We'll decide if these limitations will inhibit our ability to answer our question or if we can work with what we have to find a reasonable and reliable answer.
Some typical questions at this stage may include:
- Identifying the “right” data set(s)
- Is there enough data?
- Does it appropriately align with the question/problem statement?
- Can the dataset be trusted? How was it collected?
- Is this dataset aggregated? Can we use the aggregation or do we need to get it pre-aggregation?
- Assess resources, requirements, assumptions, and constraints
Further, we'll need to acquire the data by:
- Importing data from the web (Google Analytics, HTML, XML)
- Importing data from a file (CSV, XML, TXT, JSON)
- Importing data from a preexisting database (SQL)
- Setting up local or remote data structure
- Determining most appropriate tools to work with data (following the format and size of data)
PARSE: Understand the data
Many times we are given secondary data, or data that was previously collected. In these cases, we have to learn as much as possible about our data using tools like data dictionaries and source documentation to determine exactly how this data was gathered.
Check: Why might it be important to understand how data was collected?
A data dictionary is exactly what it sounds like - it's a set of documentation that explains what our data is and how it is formatted. Here is an example:
Variable | Description | Type of Variable
---| ---| ---
Profession | Title of the account owner | Categorical
Company Size | 1- small, 2- medium, 3- large| Categorical
Location | Planet of the company | Categorical
Days Since Last Delivery | Integer | Continuous
Number of Deliveries | Integer | Continuous
Common Tasks at this step include:
- Reading any documentation provided with the data (e.g. data dictionary above)
- Performing exploratory surface analysis via filtering, sorting, and simple visualizations
- Describing data structure and the information being collected
- Exploring variables, data types via select
- Assessing preliminary outliers, trends
- Verifying the quality of the data (feedback loop -> 1)
MINE: Prepare, structure, & clean the data
Often, our data will need to be cleaned prior performing our analysis.
Check: What do you think this means? Why is this necessary?
Common Tasks at this step include:
- Sampling the data, determine sampling methodology
- Iterating and explore outliers, null values via select
- Reviewing qualitative vs quantitative data
- Formatting and cleaning data in Python (e.g. dates, number signs, formatting)
- Defining how to appropriately address missing values (cleaning)
- Categorization, manipulation, slicing, format, integrate data
- Formatting and combining different data points, separate columns, etc.
- Determining most appropriate aggregations, cleaning methods
- Creating necessary derived columns from the data (new data)
REFINE: Exploratory Data Analysis & Iteration
At this point, you'll be conducting EDA - or exploratory data analysis. For example, you may perform some basic summary statistics and check the Mean (STD) or specific frequency counts of your data. Example:
Variable | Mean (STD) or Frequency (%)
---| ---
Number of Deliveries | 50.0 (10)
NYC | 50 (10%)
LA 9 | 100 (20%)
Portland | 100 (20%)
Seattle 8| 100 (20%)
Other | 150 (30%)
Such descriptive statistics allow us to:
- Identify trends and outliers
- Decide how to deal with outliers - excluding, filtering, and communication
- Apply descriptive and inferential statistics
- Determine initial visualization techniques
- Document and capture knowledge
- Choose visualization techniques for different data types
- Transform data
BUILD: Create a data model
One we've fully cleaned and explored the extant data, we'll attempt to build predictive models based on the outcome we are interested in or the assumptions of the model we are using. An example of a model statement might look like this:
- "Completed a logistic regression using Statsmodels. Calculated the probability of a customer placing another order with the company."
Here, we are using a logistic model because we trying to determine the probability that a customer might place a return order, which is - at its heart - a classification problem.
Some of the steps we will take to build a model includes:
- Selecting appropriate model
- Building a model
- Testing and training our model
- Evaluating and refining our model
PRESENT: Communicate the results of your analysis
Presentations are a critical part of your analysis!!!
It doesn't matter how brilliant your model is or how illuminating your findings are, if you are not able to effectively communicate your results then unfortunately they may not be used.
The most basic form of a data science presentation should include - at the very least - a simple sentence that describes your results:
- "Enterprise customers from large companies had twice (CI 1.9, 2.1) the odds of of placing another order with the company compared to enterprise customers from small companies."
Check: What do you think the CI stands for? Why should we include this in our findings?
Of course, data science presentations can also be FAR more complex and exciting - like some of the research presented by Nate Silver's 538 blog.
When creating a presentation, always consider your audience and make sure to practice your presentation beforehand. Try to plan ahead for the types of questions your audience may have or - better yet - test your presentation on a few people and pay attention to their responses. Clarify and refine your presentation accordingly.
In general, make sure to consider your needs and goals as well as those of your audience. A presentation created for your fellow data scientists will be vastly different than a presentation intended for some executives who are trying to make a business decision.
Key factors of a good presentation include:
- Summarize findings with narrative and storytelling techniques
- Refine your visualizations for broader comprehension
- Present both limitations and assumptions
- Determine the integrity of your analysis
- Consider the degree of disclosure for various stakeholders
- Test and evaluate the effectiveness of your presentation beforehand
A (Further) Note About Iteration
Iteration is an important part of every step in the Data Science Workflow. At any given point in the process, you may find yourself repeating or going back and re-doing elements in order to better understand your data, clarify your model, and refine your presentation.
For example, after presenting your findings, you may want to:
- Identify follow-up problems and questions for future analysis
- Create a visually effective summary or report
- Consider the needs of different stakeholders and how your report might be changed for them
- Identify the limitations of your analysis
- Identify relationships between visualizations
So again, remember that the Data Science Workflow is not necessarily linear, and may curve back on itself quite a few times during a typical project :)
Practice: Data Science Work Flow (25 mins)
Get to know your classmates using three of the steps from the Data Science Workflow (e.g. identify, acquire, present)!
Students should get into 4 groups, spaced at the whiteboards around the room.
A. IDENTIFY: What problems are you trying to solve?
Have each group develop 1 research question that they would like to know about the class and make a hypothesis. Don't share these questions with the class just yet!
Examples:
- What is your current favorite tool for working with data?
- What are you most excited about learning?
- What can you help your classmates with when it comes to data analysis?
B. ACQUIRE: Obtain some data from your peers!
Rotate through the groups to "collect the data" and record the raw data on white boards.
Note: Suggest students create an easy visual way for the other students to write their answers, or an option quickly to save time.
C. PRESENT: Communicate the results of your analysis :)
- Summarize findings in a narrative
- Provide a basic visualization for broader comprehension on white board
- Nominate one student to present for each group
Optional Modules
Instructors: Walk through materials from pre-course onboarding tasks and the Installfest Lesson.
- Brief overview of the tools we will use as data scientists
- Workshop to test/finalize any environmental set-up
- Test dataset and discuss pre-course onboarding takeaways (Python Syntax, Statistics, Command Line Basics, Git Basics, SQL Overview)
Conclusion (5 mins)
By now, you should be able to answer the following questions with ease:
- What is data science?
- What is the data science workflow?
- How can you have a successful learning experience at GA?
Resources
- For a useful look at the different types of data scientists, read Analyzing the Analyzers (32 pages).
- For some thoughts on what it's like to be a data scientist, read these short posts from Win-Vector and Datascope Analytics.
- Quora has a data science topic FAQ with lots of interesting Q&A.